Campaign 01 · Meta Ads
Video lead campaign
144
form leads
- Cost per form lead
- AED 13.21
- Amount spent
- AED 1,902.81
Video campaign with a June restart. The reporting screenshot shows form submissions and cost per lead.
Selected paid campaign and social content results, reported in Meta Ads Manager and social account insights. Explore lead generation, content views, audience reach and follower growth.
Explore campaign resultsSocial content resultsDiscuss your projectPerformance marketing
Six campaign reporting snapshots covering lead forms and WhatsApp enquiries. Figures are presented individually because campaigns can use different objectives and reporting windows.
Campaign 01 · Meta Ads
144
form leads
Video campaign with a June restart. The reporting screenshot shows form submissions and cost per lead.
Campaign 02 · Meta Ads
212
form leads
A separate video lead campaign with Dubai named in the ad set. Figures reflect the selected reporting view.
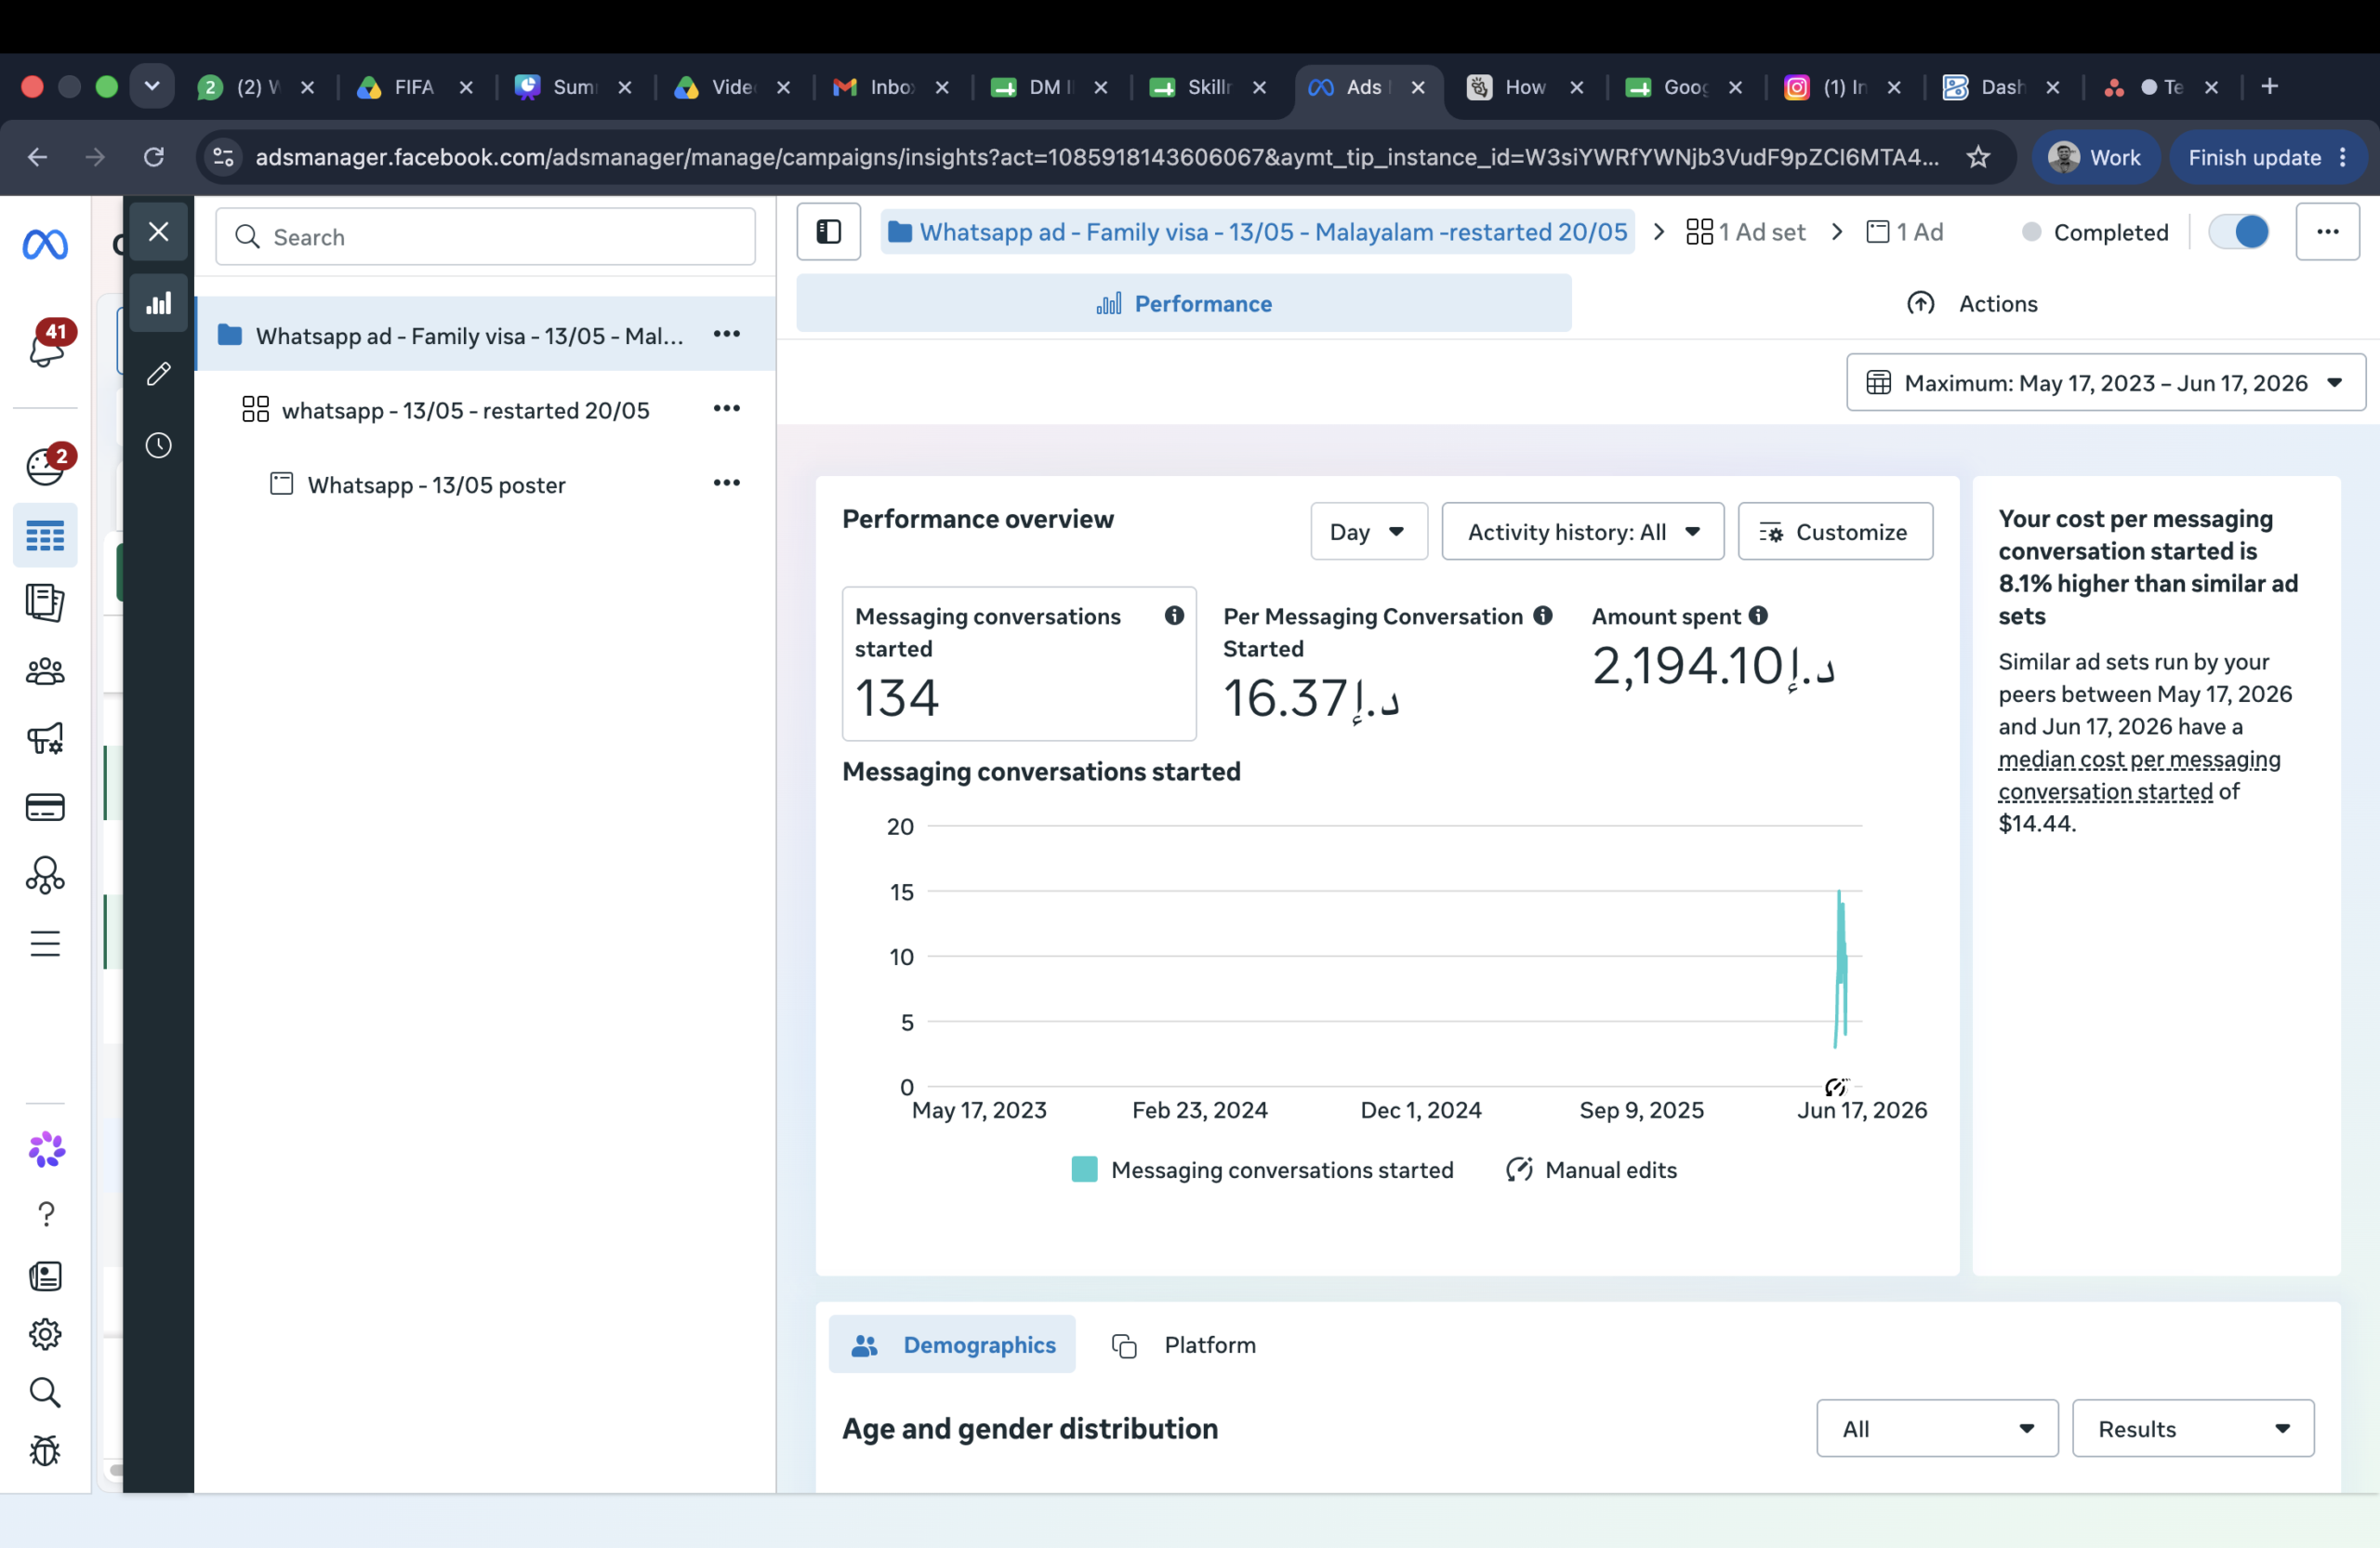
Campaign 03 · Meta Ads
134
messaging conversations started
A Malayalam-language family visa campaign. The result is conversations started, rather than form submissions or confirmed sales.
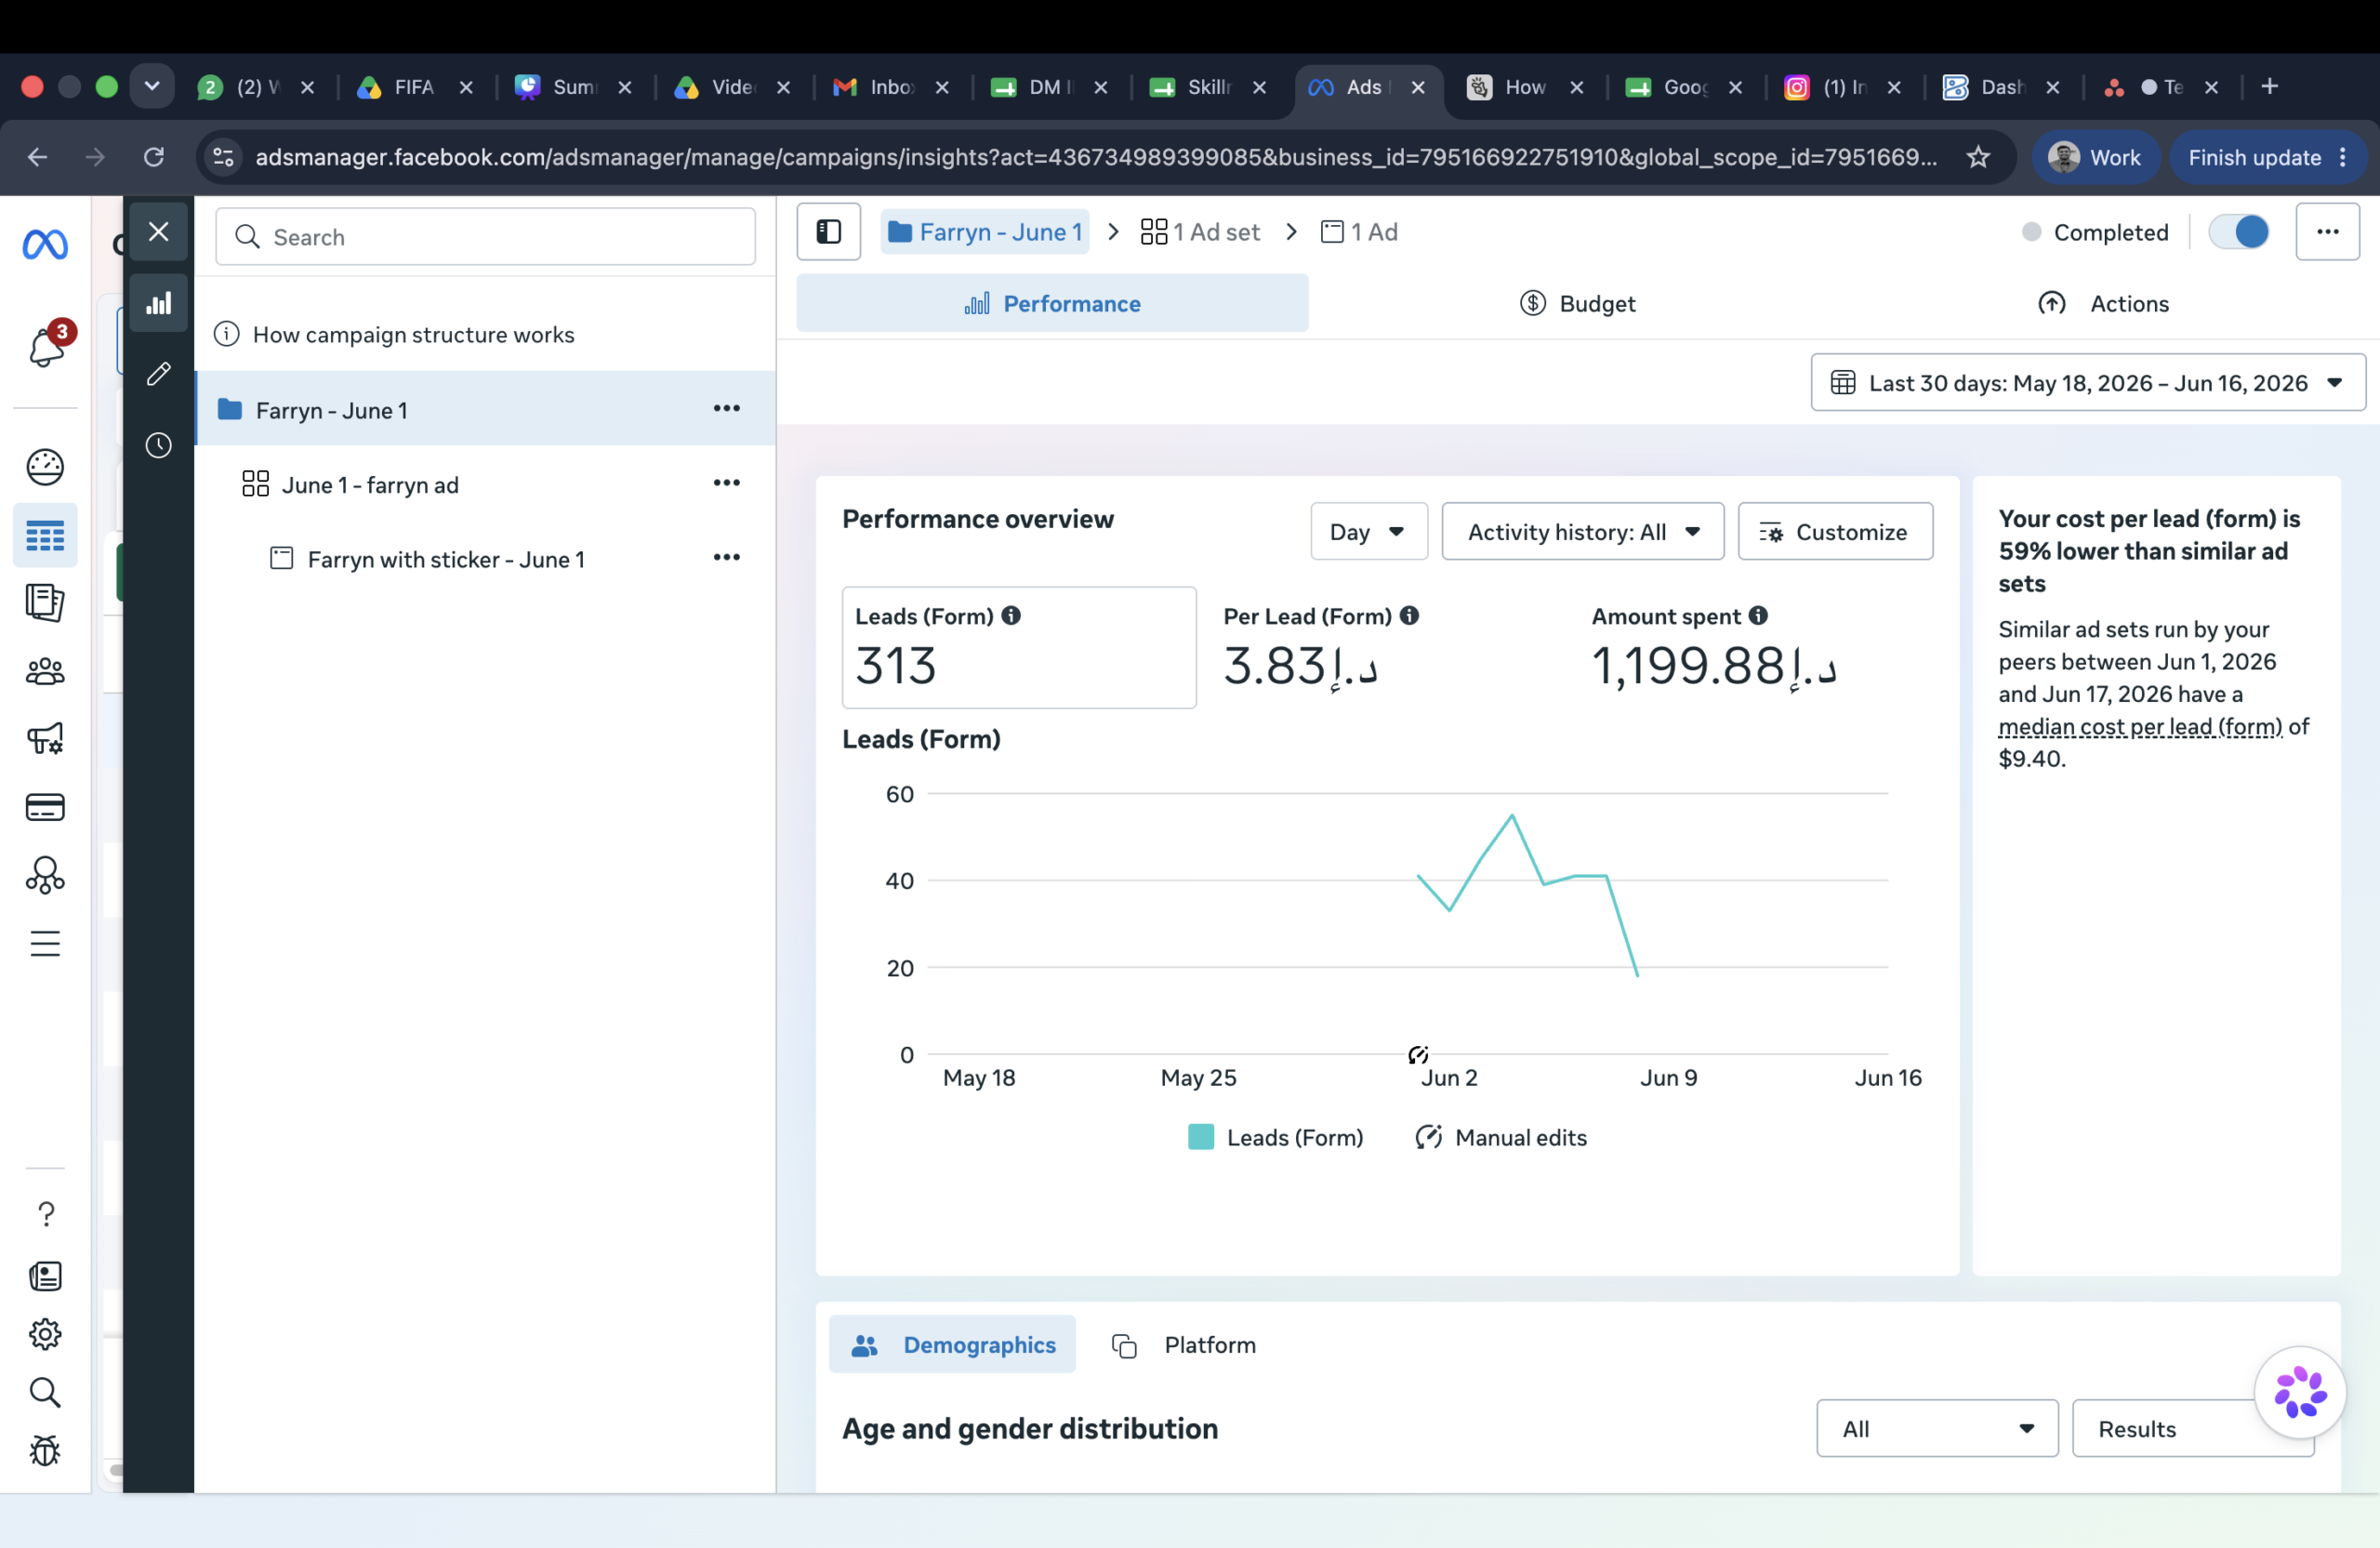
Campaign 04 · Meta Ads
313
form leads
Reporting window: 18 May–16 June 2026. The campaign is labelled June 1 in Ads Manager.
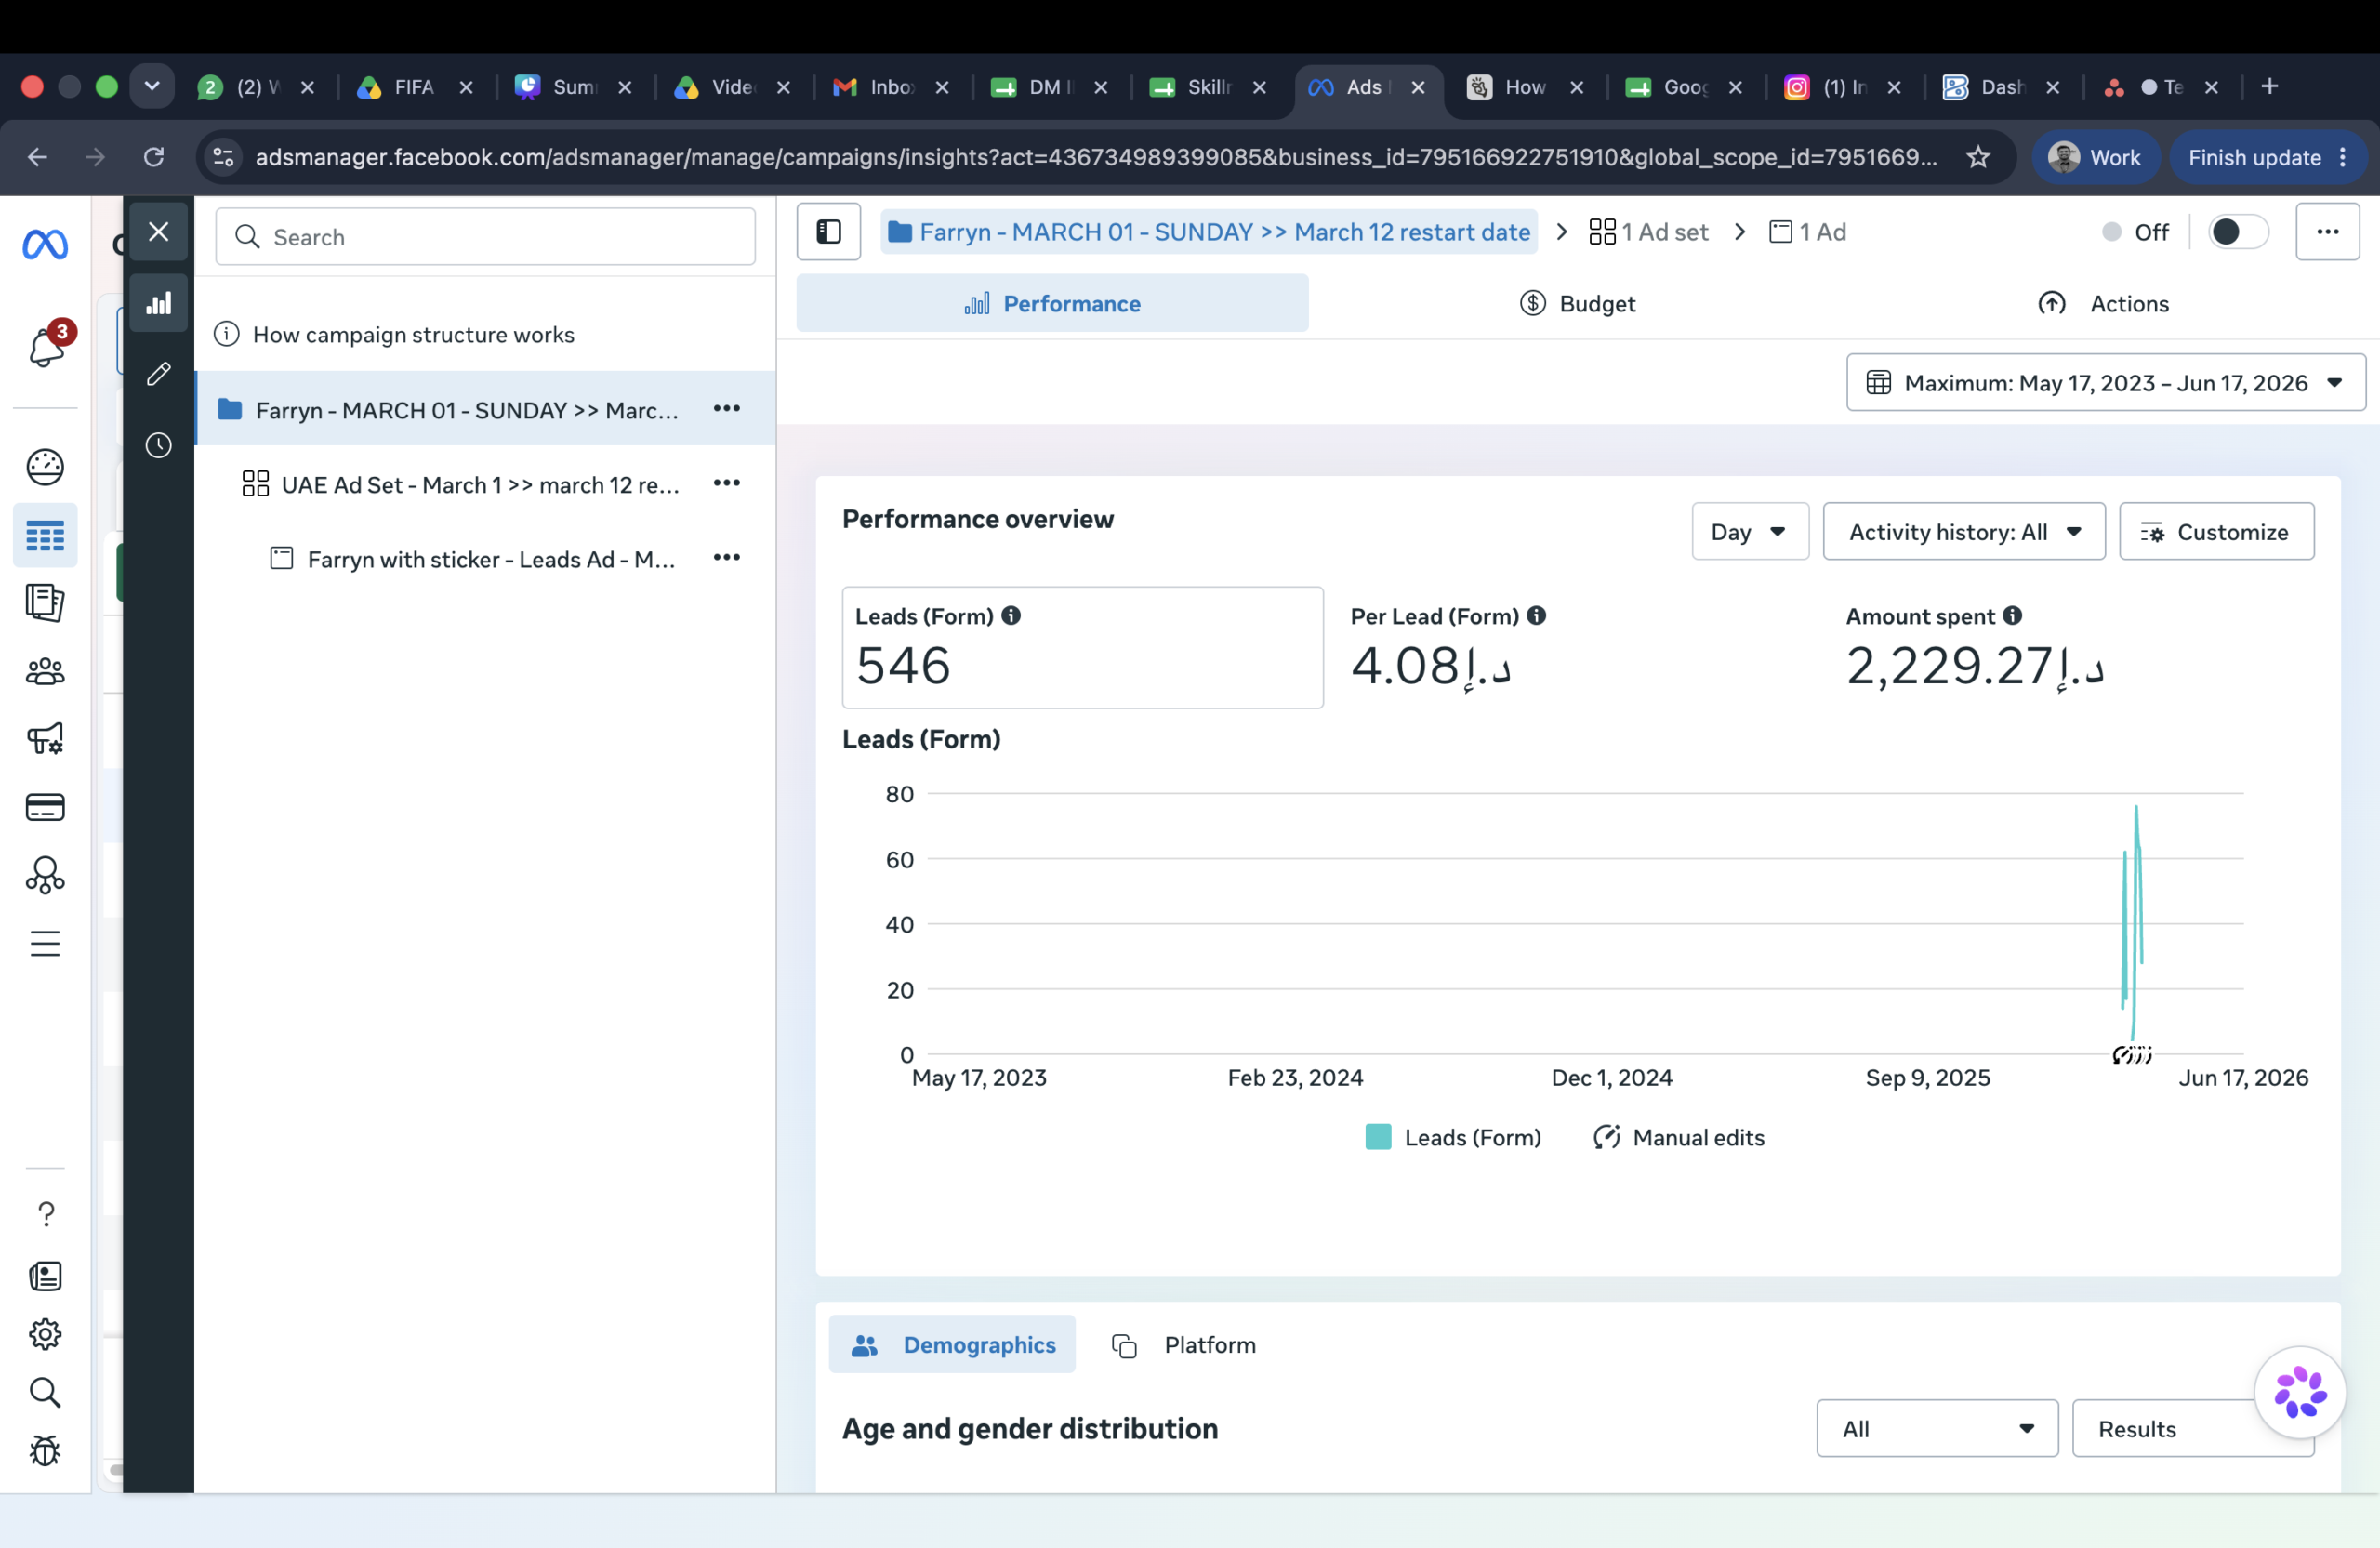
Campaign 05 · Meta Ads
546
form leads
A UAE lead form campaign with a March restart label. Results are taken from its selected reporting view.
Campaign 06 · Meta Ads
246
form leads
A seminar lead campaign targeting a selected UAE audience. The screenshot reports form leads and advertising spend.
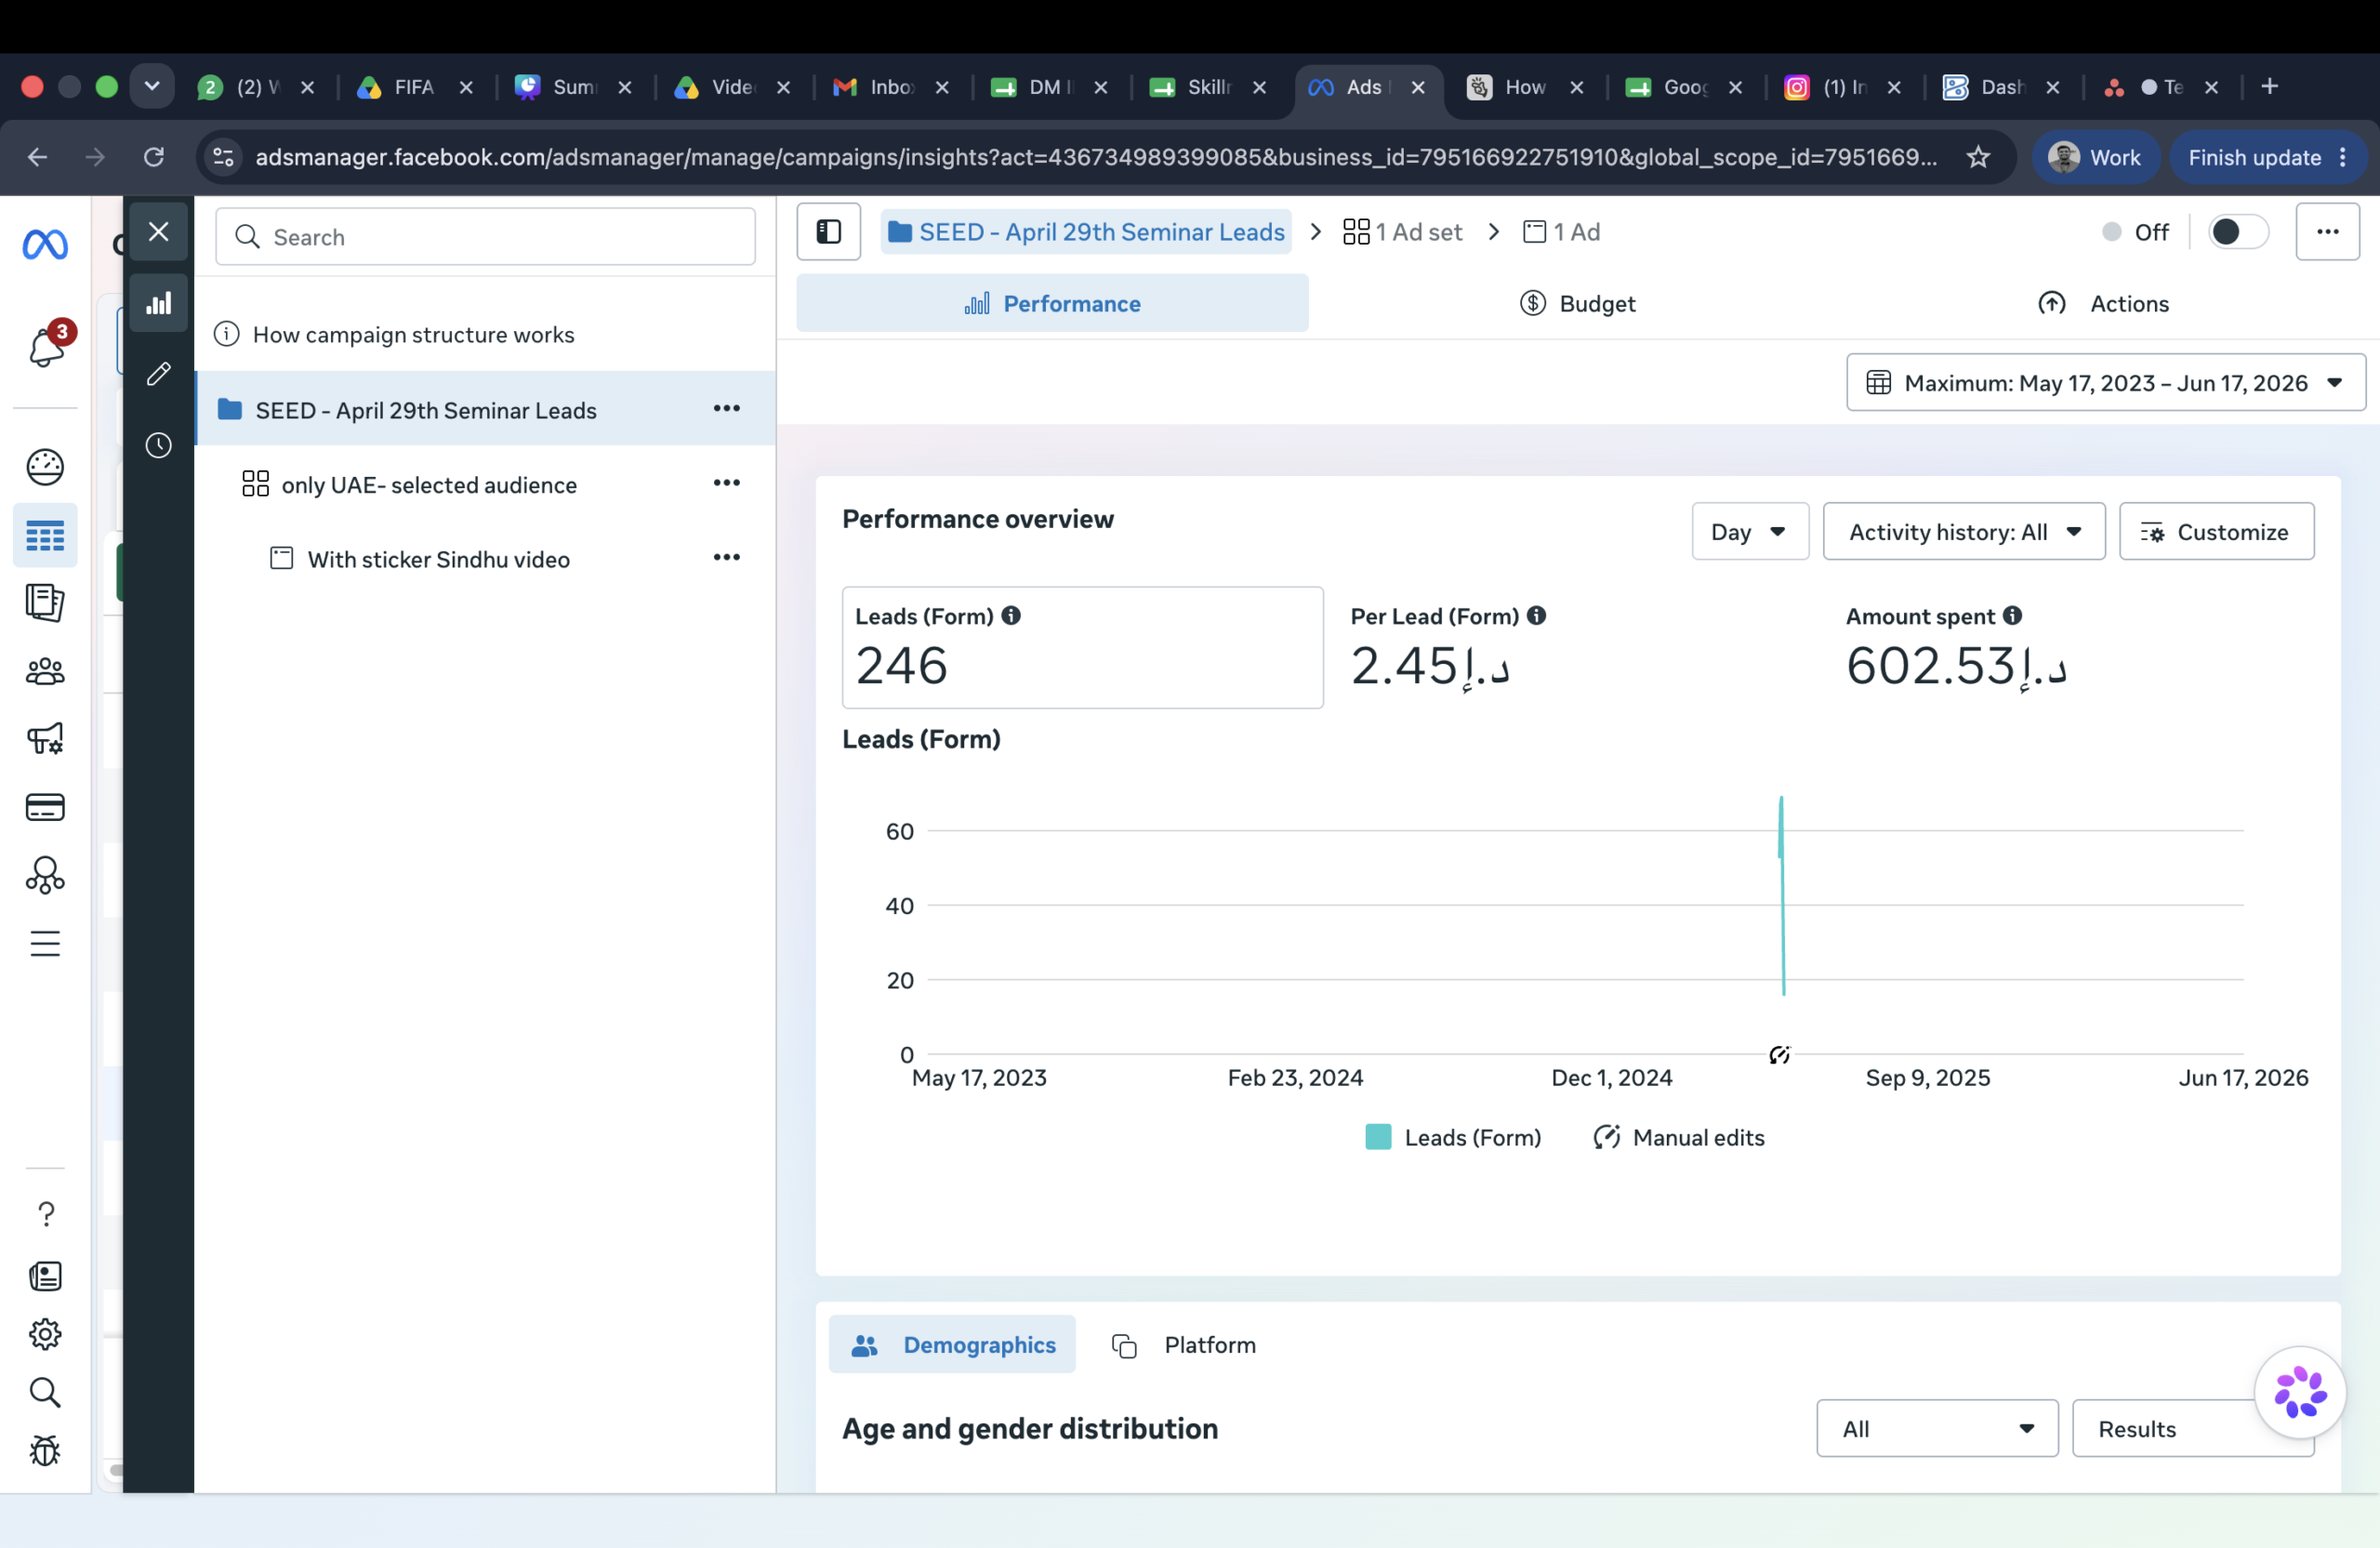
Source: Meta Ads Manager screenshots captured on 17 June 2026. Five views use the platform's maximum date filter, 17 May 2023–17 June 2026; this is a reporting filter, not a claim that these campaigns ran for three years. The June campaign uses 18 May–16 June 2026. Form leads and messaging conversations are different results; neither figure represents confirmed customers or revenue.
Tell me about your business, audience and enquiry goals. We can discuss a campaign plan and how its results will be measured.
Discuss a project on WhatsApp
Social content & audience growth
Content that reaches beyond existing followers
Two separate account reporting sets showing content views, engagement and audience growth. Results are kept separate so different accounts and reporting windows are not combined.
Reporting set A · 18 May–16 June
Reels-led visibility & engagement
962,301
content views
Reels contributed 99.6% of views and 99.9% of interactions. Non-followers accounted for 56.5% of views and 98.9% of interactions. The follower report shows 529 follows and 42 unfollows, with growth of 129.3% versus May 17.
Reporting set B · 30-day view
Social content & audience development
177,000
content views
The overview attributes 86.2% of views to non-followers. Reels recorded approximately 152K views. The audience report lists the UAE as the leading country at 62.0%; follower growth is shown as 2.6% since May 17.
Source: supplied social account insights screenshots. Account names and the year are not visible in these images, so these are anonymous reporting snapshots. The screens do not identify a paid-versus-organic split; these figures are presented as social content performance.